Debugging JavaScript Code > Finding and fixing logical errors > Setting breakpoints
Debugging JavaScript Code > Finding and fixing logical errors > Setting breakpoints |
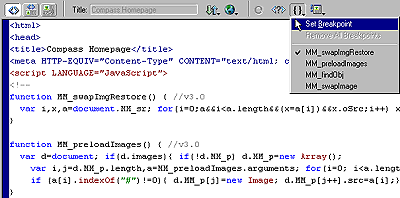
A breakpoint marks a spot in the code where you want the program execution to stop. When you set a breakpoint, it is marked with a small red dot in the left margin of the JavaScript Debugger window. When the program stops executing at that breakpoint, a small arrow appears over the dot, and you can examine the objects and properties that exist at that point. This allows you to quickly pinpoint the source of the bug in the JavaScript code.
Breakpoints can only be set in the JavaScript code (between script tags) or on a line with an event handler. If you set a breakpoint elsewhere, Dreamweaver will automatically set the breakpoint on the next valid line of code (or place the insertion point there, if the line already has a breakpoint set on it). If there are no valid lines on which a breakpoint can be set, you will hear a beep.
To set a breakpoint, do one of the following:
In the JavaScript Debugger window, place the insertion point in the line where you want the breakpoint, then click the Set/Remove Breakpoint button at the top of the debugger window. To remove the breakpoint, click the Set/Remove Breakpoint button again.

|
|
In the Code view (or Code inspector), place the insertion point in the line where you want the breakpoint, then select Edit > Set Breakpoint or choose Set Breakpoint from the Code Navigation pop-up menu in the toolbar. You can also right-click (Windows) or Control-click (Macintosh) and choose Set Breakpoint from the context menu. To remove the breakpoint, select Remove Breakpoint from the context menu.

|
To remove all breakpoints, do one of the following:
| In the JavaScript Debugger window, click the Remove All Breakpoints button. | |
| In the Code view (or Code inspector), select Remove All Breakpoints from the Code Navigation pop-up menu in the toolbar or choose Edit > Remove All Breakpoints. |
![]()