Debugging JavaScript Code > Finding and fixing logical errors
Debugging JavaScript Code > Finding and fixing logical errors |
Finding and fixing logical errors
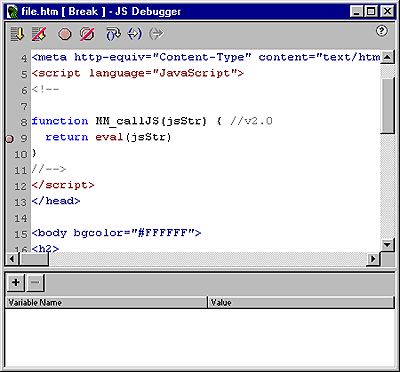
When the debugger finds logical errors, the JavaScript Debugger window opens. A breakpoint (similar to an alert) is automatically set in the first line of your code. The debugger stops executing at each breakpoint, giving you the opportunity to view the values of JavaScript objects and properties in the variable list window.

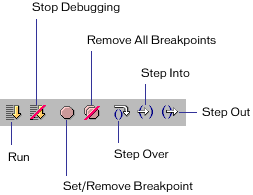
After the debugger stops at a breakpoint, you can step through your code (execute one statement at a time). This allows you to see if the program executes as it should. The debugger can even step into linked code. For example, if your code contains a link to a source file, the debugger steps into the source file and displays it in the JavaScript Debugger window. As you step through the code, you can watch as the values of your variables change through your program.
